
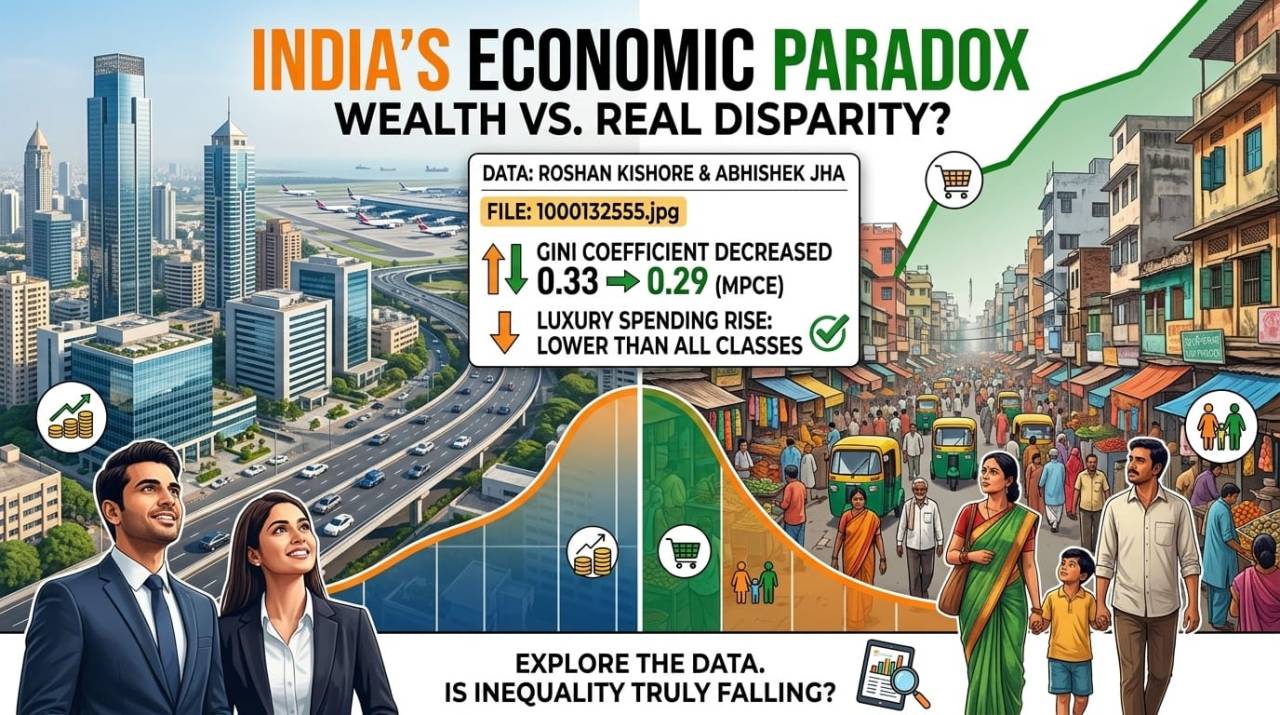
Is India becoming more equal—or more unequal? The latest data reveals a surprising truth: while consumption gaps are shrinking, wealth concentration at the top continues to rise, exposing a complex economic reality that challenges conventional narratives.
Economic inequality in India remains one of the most fiercely debated topics among policymakers, economists, and the public. Discussions about widening wealth gaps often dominate headlines, creating the impression that prosperity is increasingly concentrated among a small elite. Yet when we examine empirical data, a more nuanced picture emerges. Recent research by Roshan Kishore and Abhishek Jha, based on data from the National Sample Survey Office (NSSO), challenges some conventional assumptions by highlighting trends in India’s Monthly Per Capita Expenditure (MPCE).
Their findings suggest that while wealth inequality may have increased, consumption inequality has followed a different trajectory. Understanding this distinction is essential for evaluating India’s economic progress and the challenges that still lie ahead.
The Counter-Intuitive Trend: Falling Consumption Inequality
One of the most striking conclusions from the research is that consumption inequality in India appears to have declined since the economic reforms of the early 1990s. Economists commonly measure inequality using the Gini coefficient, a statistical indicator where 0 represents perfect equality and 1 represents absolute inequality.
According to the study, India’s overall Gini coefficient for consumption expenditure fell from 0.33 in 1993–94 to 0.29 in 2023–24. In simple terms, the distribution of household consumption has become more balanced over the past three decades.
The data also reveals several surprising trends:
Slower Growth Among the Richest
Contrary to popular assumptions, the study finds that the top 1%, top 5%, and top 10% registered the slowest proportionate growth in monthly consumption expenditure. While the average Indian experienced a 15.2% increase in MPCE over the period, the top 1% recorded a comparatively lower increase of 11.2%.
Rising Consumption Across Society
The broader population has witnessed significant gains in spending power. As incomes have improved and access to goods and services has expanded, households across various income groups have been able to consume more than previous generations.
The Food and Non-Food Divide
The contrast becomes even more apparent in non-food expenditure. The top 1% experienced an increase of only 11.3% in non-food spending, whereas all classes combined recorded growth of 21.6%. This suggests that a larger segment of the population is gradually catching up in discretionary spending categories such as education, transportation, communication, and consumer goods.
Greater Equality Within the Wealthiest Group
Interestingly, inequality among the richest households themselves has also declined. The intra-class Gini coefficient for the top 1% dropped from 0.28 in 1993–94 to 0.15 in 2023–24, indicating a more even distribution of consumption within that elite segment.
The Missing Link: Does Consumption Tell the Whole Story?
While these findings point toward declining consumption inequality, they also raise an important question: Can consumption data fully capture economic inequality in modern India?
Many economists argue that household consumption surveys have inherent limitations, particularly when it comes to measuring the lifestyles and spending patterns of ultra-high-net-worth individuals. Wealthy households are often underrepresented in survey samples, and much of their economic power is reflected in assets rather than day-to-day consumption.
Several examples illustrate this challenge.
The Luxury Car Puzzle
In 2023–24, luxury car registrations in India—vehicles priced between ₹40 lakh and ₹2 crore—were estimated at around 42,000 to 45,000 units. However, extrapolations from survey responses suggest only about 5,390 households reported such purchases. This significant gap indicates that the spending habits of the wealthiest Indians may not be fully captured by household surveys.
The Aviation Disconnect
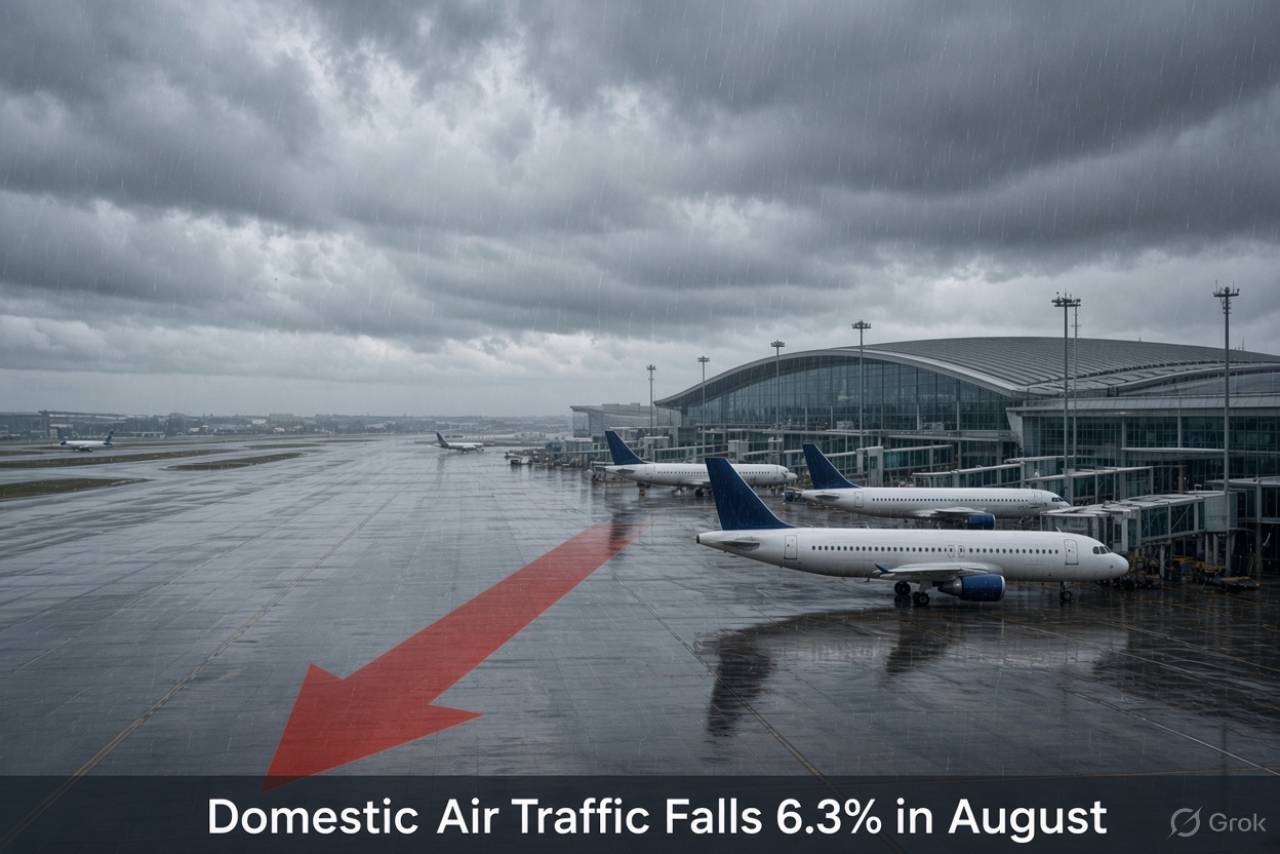
A similar discrepancy emerges in air travel data. According to figures from the Directorate General of Civil Aviation (DGCA), domestic air passenger traffic increased dramatically over the past decade, rising from 60.6 million to 153.4 million passengers. Yet consumption survey estimates imply travel patterns that do not align with these aggregate numbers, suggesting substantial underreporting among frequent flyers and affluent households.
These inconsistencies do not invalidate consumption data, but they do highlight its limitations as a standalone measure of inequality.
Consumption Inequality Versus Wealth Inequality
A critical distinction often overlooked in public debates is the difference between consumption inequality and wealth inequality.
Consumption reflects what people spend. Wealth reflects what people own.
Even the wealthiest individuals have practical limits on how much food they can eat, clothing they can wear, or services they can consume. As a result, consumption patterns tend to be less unequal than asset ownership.
Research by international institutions and economic scholars indicates that wealth concentration in India has increased significantly in recent decades. Rising stock market valuations, real estate appreciation, business ownership, and financial assets have disproportionately benefited those who already possess capital. Consequently, the top tier of society controls a growing share of national wealth.
At the same time, millions of Indians have experienced improvements in their standard of living through economic growth, welfare programs, digital financial inclusion, infrastructure expansion, and improved access to essential services. These developments have helped narrow gaps in everyday consumption even as wealth disparities persist.
What the Data Really Tells Us
The evidence suggests that both narratives contain elements of truth.
On one hand, India’s economic growth has improved living standards for large sections of the population. Rising consumption levels indicate that more households can afford goods and services that were once beyond their reach. This represents meaningful progress and should not be overlooked.
On the other hand, declining consumption inequality does not mean wealth inequality has disappeared. Asset ownership remains highly concentrated, and traditional consumption surveys may not fully capture the economic influence of the wealthiest households.
Final Take
India’s inequality story is far more complex than a single statistic can convey. Consumption data shows encouraging signs that economic progress has expanded opportunities and improved living standards across much of society. At the same time, wealth concentration at the top remains a significant reality, shaping long-term economic and social outcomes.
Rather than viewing these findings as contradictory, they should be seen as complementary pieces of a larger puzzle. India today is a country where consumption gaps have narrowed for many citizens, yet substantial wealth disparities continue to exist. Understanding both realities is essential for designing policies that promote not only growth, but also genuinely inclusive prosperity.
The challenge for policymakers in the years ahead will be to sustain rising living standards while expanding access to quality education, productive employment, and wealth-building opportunities. Only then can economic progress translate into broader and more enduring equality.
Economic inequality in India remains one of the most fiercely debated topics among policymakers, economists, and the public. Discussions about widening wealth gaps often dominate headlines, creating the impression that prosperity is increasingly concentrated among a small elite. Yet when we examine empirical data, a more nuanced picture emerges. Recent research by Roshan Kishore and Abhishek Jha, based on data from the National Sample Survey Office (NSSO), challenges some conventional assumptions by highlighting trends in India’s Monthly Per Capita Expenditure (MPCE).
Their findings suggest that while wealth inequality may have increased, consumption inequality has followed a different trajectory. Understanding this distinction is essential for evaluating India’s economic progress and the challenges that still lie ahead.
The Counter-Intuitive Trend: Falling Consumption Inequality
One of the most striking conclusions from the research is that consumption inequality in India appears to have declined since the economic reforms of the early 1990s. Economists commonly measure inequality using the Gini coefficient, a statistical indicator where 0 represents perfect equality and 1 represents absolute inequality.
According to the study, India’s overall Gini coefficient for consumption expenditure fell from 0.33 in 1993–94 to 0.29 in 2023–24. In simple terms, the distribution of household consumption has become more balanced over the past three decades.
The data also reveals several surprising trends:
Slower Growth Among the Richest
Contrary to popular assumptions, the study finds that the top 1%, top 5%, and top 10% registered the slowest proportionate growth in monthly consumption expenditure. While the average Indian experienced a 15.2% increase in MPCE over the period, the top 1% recorded a comparatively lower increase of 11.2%.
Rising Consumption Across Society
The broader population has witnessed significant gains in spending power. As incomes have improved and access to goods and services has expanded, households across various income groups have been able to consume more than previous generations.
The Food and Non-Food Divide
The contrast becomes even more apparent in non-food expenditure. The top 1% experienced an increase of only 11.3% in non-food spending, whereas all classes combined recorded growth of 21.6%. This suggests that a larger segment of the population is gradually catching up in discretionary spending categories such as education, transportation, communication, and consumer goods.
Greater Equality Within the Wealthiest Group
Interestingly, inequality among the richest households themselves has also declined. The intra-class Gini coefficient for the top 1% dropped from 0.28 in 1993–94 to 0.15 in 2023–24, indicating a more even distribution of consumption within that elite segment.
The Missing Link: Does Consumption Tell the Whole Story?
While these findings point toward declining consumption inequality, they also raise an important question: Can consumption data fully capture economic inequality in modern India?
Many economists argue that household consumption surveys have inherent limitations, particularly when it comes to measuring the lifestyles and spending patterns of ultra-high-net-worth individuals. Wealthy households are often underrepresented in survey samples, and much of their economic power is reflected in assets rather than day-to-day consumption.
Several examples illustrate this challenge.
The Luxury Car Puzzle
In 2023–24, luxury car registrations in India—vehicles priced between ₹40 lakh and ₹2 crore—were estimated at around 42,000 to 45,000 units. However, extrapolations from survey responses suggest only about 5,390 households reported such purchases. This significant gap indicates that the spending habits of the wealthiest Indians may not be fully captured by household surveys.
The Aviation Disconnect
A similar discrepancy emerges in air travel data. According to figures from the Directorate General of Civil Aviation (DGCA), domestic air passenger traffic increased dramatically over the past decade, rising from 60.6 million to 153.4 million passengers. Yet consumption survey estimates imply travel patterns that do not align with these aggregate numbers, suggesting substantial underreporting among frequent flyers and affluent households.
These inconsistencies do not invalidate consumption data, but they do highlight its limitations as a standalone measure of inequality.
Consumption Inequality Versus Wealth Inequality
A critical distinction often overlooked in public debates is the difference between consumption inequality and wealth inequality.
Consumption reflects what people spend. Wealth reflects what people own.
Even the wealthiest individuals have practical limits on how much food they can eat, clothing they can wear, or services they can consume. As a result, consumption patterns tend to be less unequal than asset ownership.
Research by international institutions and economic scholars indicates that wealth concentration in India has increased significantly in recent decades. Rising stock market valuations, real estate appreciation, business ownership, and financial assets have disproportionately benefited those who already possess capital. Consequently, the top tier of society controls a growing share of national wealth.
At the same time, millions of Indians have experienced improvements in their standard of living through economic growth, welfare programs, digital financial inclusion, infrastructure expansion, and improved access to essential services. These developments have helped narrow gaps in everyday consumption even as wealth disparities persist.
What the Data Really Tells Us
The evidence suggests that both narratives contain elements of truth.
On one hand, India’s economic growth has improved living standards for large sections of the population. Rising consumption levels indicate that more households can afford goods and services that were once beyond their reach. This represents meaningful progress and should not be overlooked.
On the other hand, declining consumption inequality does not mean wealth inequality has disappeared. Asset ownership remains highly concentrated, and traditional consumption surveys may not fully capture the economic influence of the wealthiest households.
Final Take
India’s inequality story is far more complex than a single statistic can convey. Consumption data shows encouraging signs that economic progress has expanded opportunities and improved living standards across much of society. At the same time, wealth concentration at the top remains a significant reality, shaping long-term economic and social outcomes.
Rather than viewing these findings as contradictory, they should be seen as complementary pieces of a larger puzzle. India today is a country where consumption gaps have narrowed for many citizens, yet substantial wealth disparities continue to exist. Understanding both realities is essential for designing policies that promote not only growth, but also genuinely inclusive prosperity.
The challenge for policymakers in the years ahead will be to sustain rising living standards while expanding access to quality education, productive employment, and wealth-building opportunities. Only then can economic progress translate into broader and more enduring equality.


















Leave a Comment